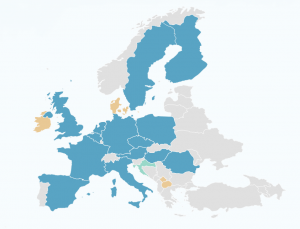
Using this interactive map, you can download a variety of resources linked to specific countries in Europe. Included are some reports and maps made during STRATEGO, a previous Heat Roadmap Europe study, as well as resources developed by other partners. If you wish your maps to be included too or add a link, please contact us.

Throughout the Heat Roadmap Europe projects, maps have been produced both at a European and at a national scale. For more information on how to use the maps, including the interactive Pan-European Thermal Atlas, watch the Video Tutorial for Using the Maps (10 minutes).
Peta 4.3
The newest version, now features a complete assessment of the heating sector, from end-use via heat supply infrastructures to potential heat supply sources. Additionally, several editorial changes for improved usability and user-friendliness implemented at the web map application
New layers are added and several updates to layers from 4.2 version have been made. In particular, these changes involve operational layers for:
- Supply
- Allocated excess heat (new)
- Geothermal potential (update)
- Low-temperature excess heat from Metro stations (new)
- Low-temperature excess heat from Waste water treatment plants (new)
- Infrastructure
- Recommended DH levels (new)
- Prospective Supply Districts (update)
- Demand
- Cold demand density (update)
This version represents a significant update with even more valuable information available for the public to utilise. Though Peta 4.1 provided new datasets at a higher resolution than previous iterations, Peta 4.2 goes several steps beyond. Its 10 layers together supply a range of useful inputs for integration into energy planning:
- The classification of heat synergy regions can greatly facilitate you in planning priorities to decarbonise across regions.
- You can also discover which excess heat and renewable energy sources are just waiting to be exploited in your own area.
- Now you not only have access to the previous cutting-edge grid of modelled heat demand from before, but also a new 100m-resolution grid portraying urban cooling demand densities.
- Building on previous mapping of district heating systems you’ll be able to identify even more prospective supply areas, each classified by heat demand densities.
- Finally, in order to exploit these demands effectively, you can now pinpoint where would be the most cost-effective for implementing district infrastructure in your city.
Read the user manual to uncover more information.